- AI-Native Training
- SAFe Training
- Choose a Course
- Public Training Schedule
- SAFe Certifications
- Leading SAFe
- Implementing SAFe
- Advanced SAFe Practice Consultant
- Leading SAFe for Government
- SAFe Lean Portfolio Management
- SAFe Release Train Engineer
- SAFe for Hardware
- SAFe for Architects
- Agile Product Management
- SAFe Scrum Master
- Advanced Scrum Master
- SAFe DevOps
- SAFe Product Owner/Product Manager
- SAFe Agile Software Engineering
- SAFe for Teams
- SAFe Micro-credentials
- Agile HR Training
Baseline Metrics Before You Start
If you do nothing else before you launch your Agile Release Train (ART) baseline your metrics! At some point, in the not too distant future, you are going to be asked, how do you know your Agile Release Train is making a difference? For you the answer might be obvious - it just feels better. It was very much that way for me with my first ART. Metrics weren’t the first indicator that things were getting better, it was the changes in behaviour.
When I first took over the EDW delivery organisation, my days were spent dealing with escalations, trying to drum up work for my teams and trying to stem the tide of staff exits. I knew SAFe was making a difference when my phone stopped ringing off the hook with escalated complaints about not delivering, demand started to increase and people were queuing up to join the team not exit it! The other really telling behaviour change was when our sponsors lost interest in holding monthly governance meetings. Apparently if you are delivering on your commitments governance meetings are less interesting to executives! That reminds me of perhaps the most obvious observable change that gave me confidence that we were getting better - the delivery of working software! In the context of my first train this was nothing short of a miracle!
When I first took over the EDW delivery organisation, my days were spent dealing with escalations, trying to drum up work for my teams and trying to stem the tide of staff exits. I knew SAFe was making a difference when my phone stopped ringing off the hook with escalated complaints about not delivering, demand started to increase and people were queuing up to join the team not exit it! The other really telling behaviour change was when our sponsors lost interest in holding monthly governance meetings. Apparently if you are delivering on your commitments governance meetings are less interesting to executives! That reminds me of perhaps the most obvious observable change that gave me confidence that we were getting better - the delivery of working software! In the context of my first train this was nothing short of a miracle!
While the changes in behaviour I observed were enough to convince me we were making a difference, management will always want metrics. As Jeffrey Liker said in his book The Toyota Way: “It is advisable to keep the number of metrics to a minimum. Remember that tracking metrics takes time away from people doing their work. It is also important at this stage to discuss the existing metrics and immediately eliminate ones that are superfluous or drive behaviours that are counter to the implementation of the lean future state vision.”
Below I have captured some of the metrics I like to use when launching Agile Release Trains, some of which you may recognise as also being recommended in the Scaled Agile Framework article on Metrics.
Employee Net Promoter Score (eNPS)
As I have written about previously, I first came across this metric when reading up on the Net Promoter System (NPS). NPS is a customer loyalty measurement identified by Fred Reichheld and some folks at Bain. When understanding drivers of customer loyalty they determined that: “Very few companies can achieve or sustain high customer loyalty without a cadre of loyal, engaged employees.” Employee NPS is measured by asking the question: “On a scale of 0 to 10, where 0 is not at all likely and 10 is extremely likely, how likely are you to you recommend working on [insert ART name] to a friend of colleague?” Those who answer 9 or 10 are classified as promoters, those who respond 7 or 8 are classified as passives and those who respond with a 6 or below are classified as detractors. The NPS score is calculated by subtracting the percentage of detractors from the percentage of promoters. You should be expecting eNPS to increase as a result of launching your ART.
Stakeholder Net Promoter Score (NPS)
This is my take on NPS for the stakeholders of your ART(s). We use the same approach as outlined about eNPS, but this time the question is “On a scale of 0 to 10, where 0 is not at all likely and 10 is extremely likely, how likely are you to you recommend the delivery services of [insert ART name] to a friend of colleague?” You should also expect to see this go up over time.
Cycle Time
Once you have your ART(s) up and running you should be able to capture cycle time for features, where cycle time is calculated as the total processing time from the beginning to the end of your process. When we launch ARTs, we usually create an ART Kanban system to visualise the flow of feature through the ART. If you track the movement of the features through the Kanban this will give you cycle time data. You should expect to see this decrease once your ART has been up and running for a while.
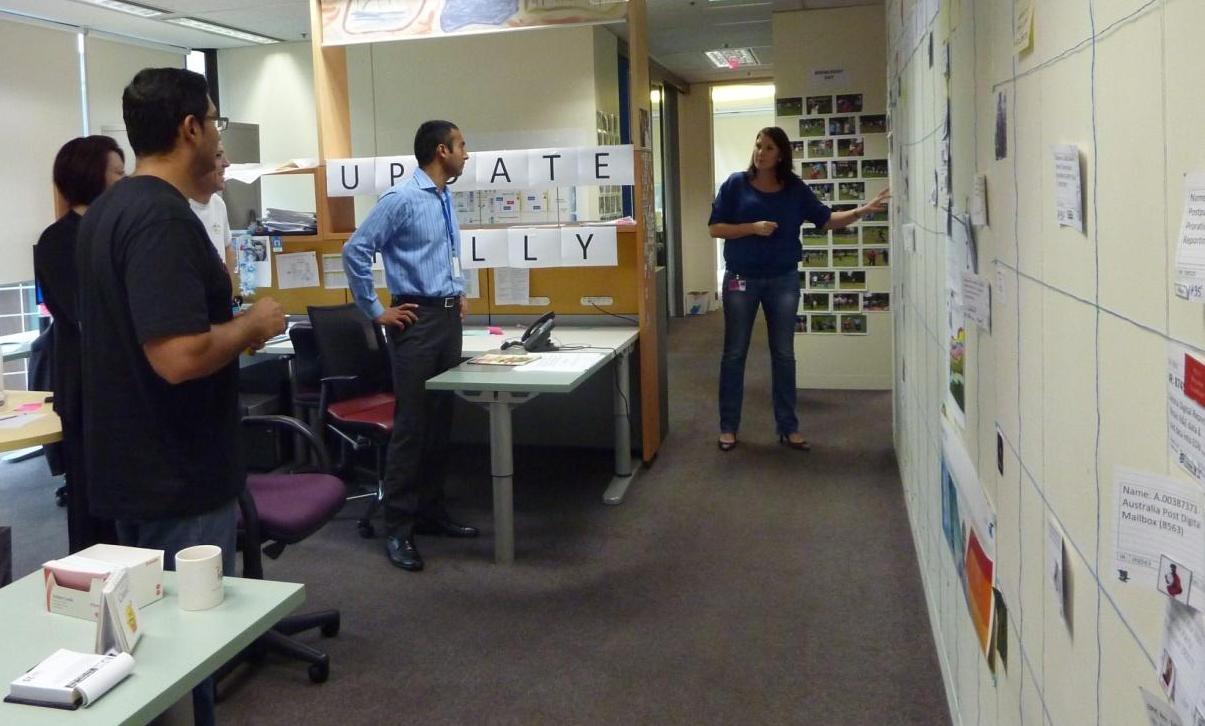
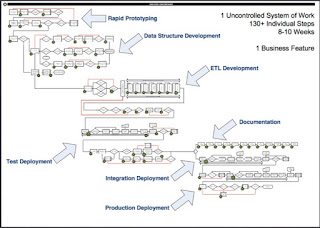
Baselining cycle time might be challenging as you probably don’t have epics or features as the beginning of your SAFe journey. In this case, my advice is to measure the cycle time of projects or your current equivalent. Another way I have seen this done is by mapping the development value stream. This can be done very informally, by taking a pencil and a sheet of A3 paper and walking the process. Noting the steps, the time they take to execute and the wait times between each step. You can then revisit this map periodically updating it and hopefully showing a reduction in cycle time. Alternatively, the SAFe DevOps class includes this exercise and/or Karen Martin’s book Value Stream Mapping provides a detailed workshop guide.
Frequency of Release
This one looks at how frequently your ART delivers outcomes to its customers. Often articulated as frequency in a period eg. once a year, or twice a quarter etc. For many traditional organisations this dictated by the Enterprise Release cycle. You should expect to see this increase.
Escaped Defects
This is a count of defects that make it to production, or “escape” your system. Two common approaches are to capture the number per release or the number per time period. You should expect to see this decrease.
In a code base with a lot of technical debt, you may find that your identification of defects increases in your early PIs as teams become more disciplined about recording defects they find while working on new features. While ideally these defects would have been fixed as they were discovered. We have a view that if a defect will require enough work that it will impact the specific feature or sprint objectives being worked on at the time then teams should choose to record the defect for future prioritisation. This way the entire team can see the defect and the Product Owner can make a responsible decision about prioritising it while maintaining balance for the committed prioritised objectives.
Test Automation
If your Agile Release Train is software related then you will want to baseline your level of test automation. This is you total number of automated tests as a percentage of your total number of tests (manual and automated). Some organisations will start with a zero and may take some time to get started with test automation, but keeping it visible on your list of metrics will help bring focus. Of course, we are looking to have the percentage of automated tests increase over time due to both the creation of automated tests and the removal of manual tests.
Ratio of “Doers” vs “Non-Doers”
Another interesting metric to baseline and track is the percentage of people “doing the work” as a proportion of the people work in the department. “Doers” tends to be defined as people who define, build, test, deploy (e.g agile teams), making everyone else a “non-doer”. You should expect to see the ratio of doers increase as your ART matures.
Market Performance
If your ART is aligned to a Product or Service monetised by your company, you might also find it interesting to baseline the current market performance of that product or service. Some examples include Volume of Sales, Services in Operation and Market Share. In a similar, but perhaps, more daring approach the folks at TomTom used Share Price to demonstrate the value of SAFe in the Agile2014 presentation Adopting Scaled Agile Framework (SAFe): The Good, the Bad, and the Ugly.
Some metrics you won't be able to baseline before you start but you can start tracking once you begin executing your first program increment.
Cost per Story Point
It is likely that you won't be using SAFe’s approach to normalized estimation prior to launching your ART therefore you probably won't be able to baseline this one before you start. However, to be able to do this once you have started you will need to be using normalised estimation, know the labour cost of your ART and determine your approach to capturing “actuals”. For a more detailed explanation of the Cost per Story Point calculation check out: Understanding Cost in a SAFe World.
Almost any cost based metric will be difficult to prove and you will almost certainly be asked how you calculated it. One of the ways I have backed up my assertions with respect to reduced cost per story point is by triangulating that data to see if other approaches to calculating cost reduction yield similar results. One such “test” is to take a “project” or epic that was originally estimated using a traditional or waterfall method and look at the actual costs after delivering it using SAFe. While by no means perfect, it may help support your argument that costs are decreasing.
ART Predictability Measure
In addition the self-assessments, SAFe offers the ART Predictability Measure as a way to measure Agility. Personally, I see this more as a measure of predictability rather than agility, but then again I don’t believe in trying to measure agility
This seems to be one of the most commonly missed parts of SAFe. To be able to calculate this you need to capture the Business Value of the PI Objectives at PI Planning. Sometimes this gets skipped due to time pressure and other times the organisation deliberately skips this as it is perceived as “too subjective”. Of course, it is subjective, but I figure this is mitigated by ensuring the people who provide the Business Value at PI Planning are the same people who provide the actual value as part of the Inspect & Adapt.
The other trap I see organisations fall into is changing the objectives and the business value during the PI, as it is not the teams fault that “the business” changed their mind. Correct! It is also not the teams fault when the system is unpredictable! If you stick to using the objectives from PI Planning the PI Predictability Measures will reflect the health of the entire system - both the teams delivery on commitments and the businesses commitment to the process. If you change the objectives you no longer have a measure of predictability!
Armed with all the above metrics, it is my hope that you will be able to avoid the dreaded Agile Maturity metric.
Agility (or Agile Maturity)
I have yet to see an approach to this that doesn’t require teams to be “assessed”. In my view the only valuable agile assessment of a team is a self-assessment. If the results of self-assessment become a “measure” of agile maturity, the learning value of the exercise will likely be lost. After all, as the popular proverb says; “What gets measured, gets done.” So please, whatever you do, don’t try and measure Agile Maturity by assessing teams. Instead focus on NPS, cycle time, escaped defects and test automation . Moving these numbers is a sign you are headed in the right direction.


